Campus-Sync: Gopher Tunnel Navigation System
Led end-to-end UX research and product design for a web application solving real navigation challenges for 50,000+ University of Minnesota students traversing 7+ miles of underground tunnels in harsh winters. Applied mixed-methods approach: contextual inquiry (shadowing 15 users in extreme weather), task analysis (mapping 40+ navigation scenarios), and iterative usability testing (3 rounds, n=25). Integrated campus mapping API with building access hours database. Achieved 80% user satisfaction (SUS: 82/100), 90% routing accuracy, 70% mobile adoption. Product deployed and serving daily active users.
The Problem
We watched a student walk to a tunnel entrance, pause, look uncertain, then turn around and go outside in -20°F weather. She knew the tunnels existed. She just couldn't trust them.
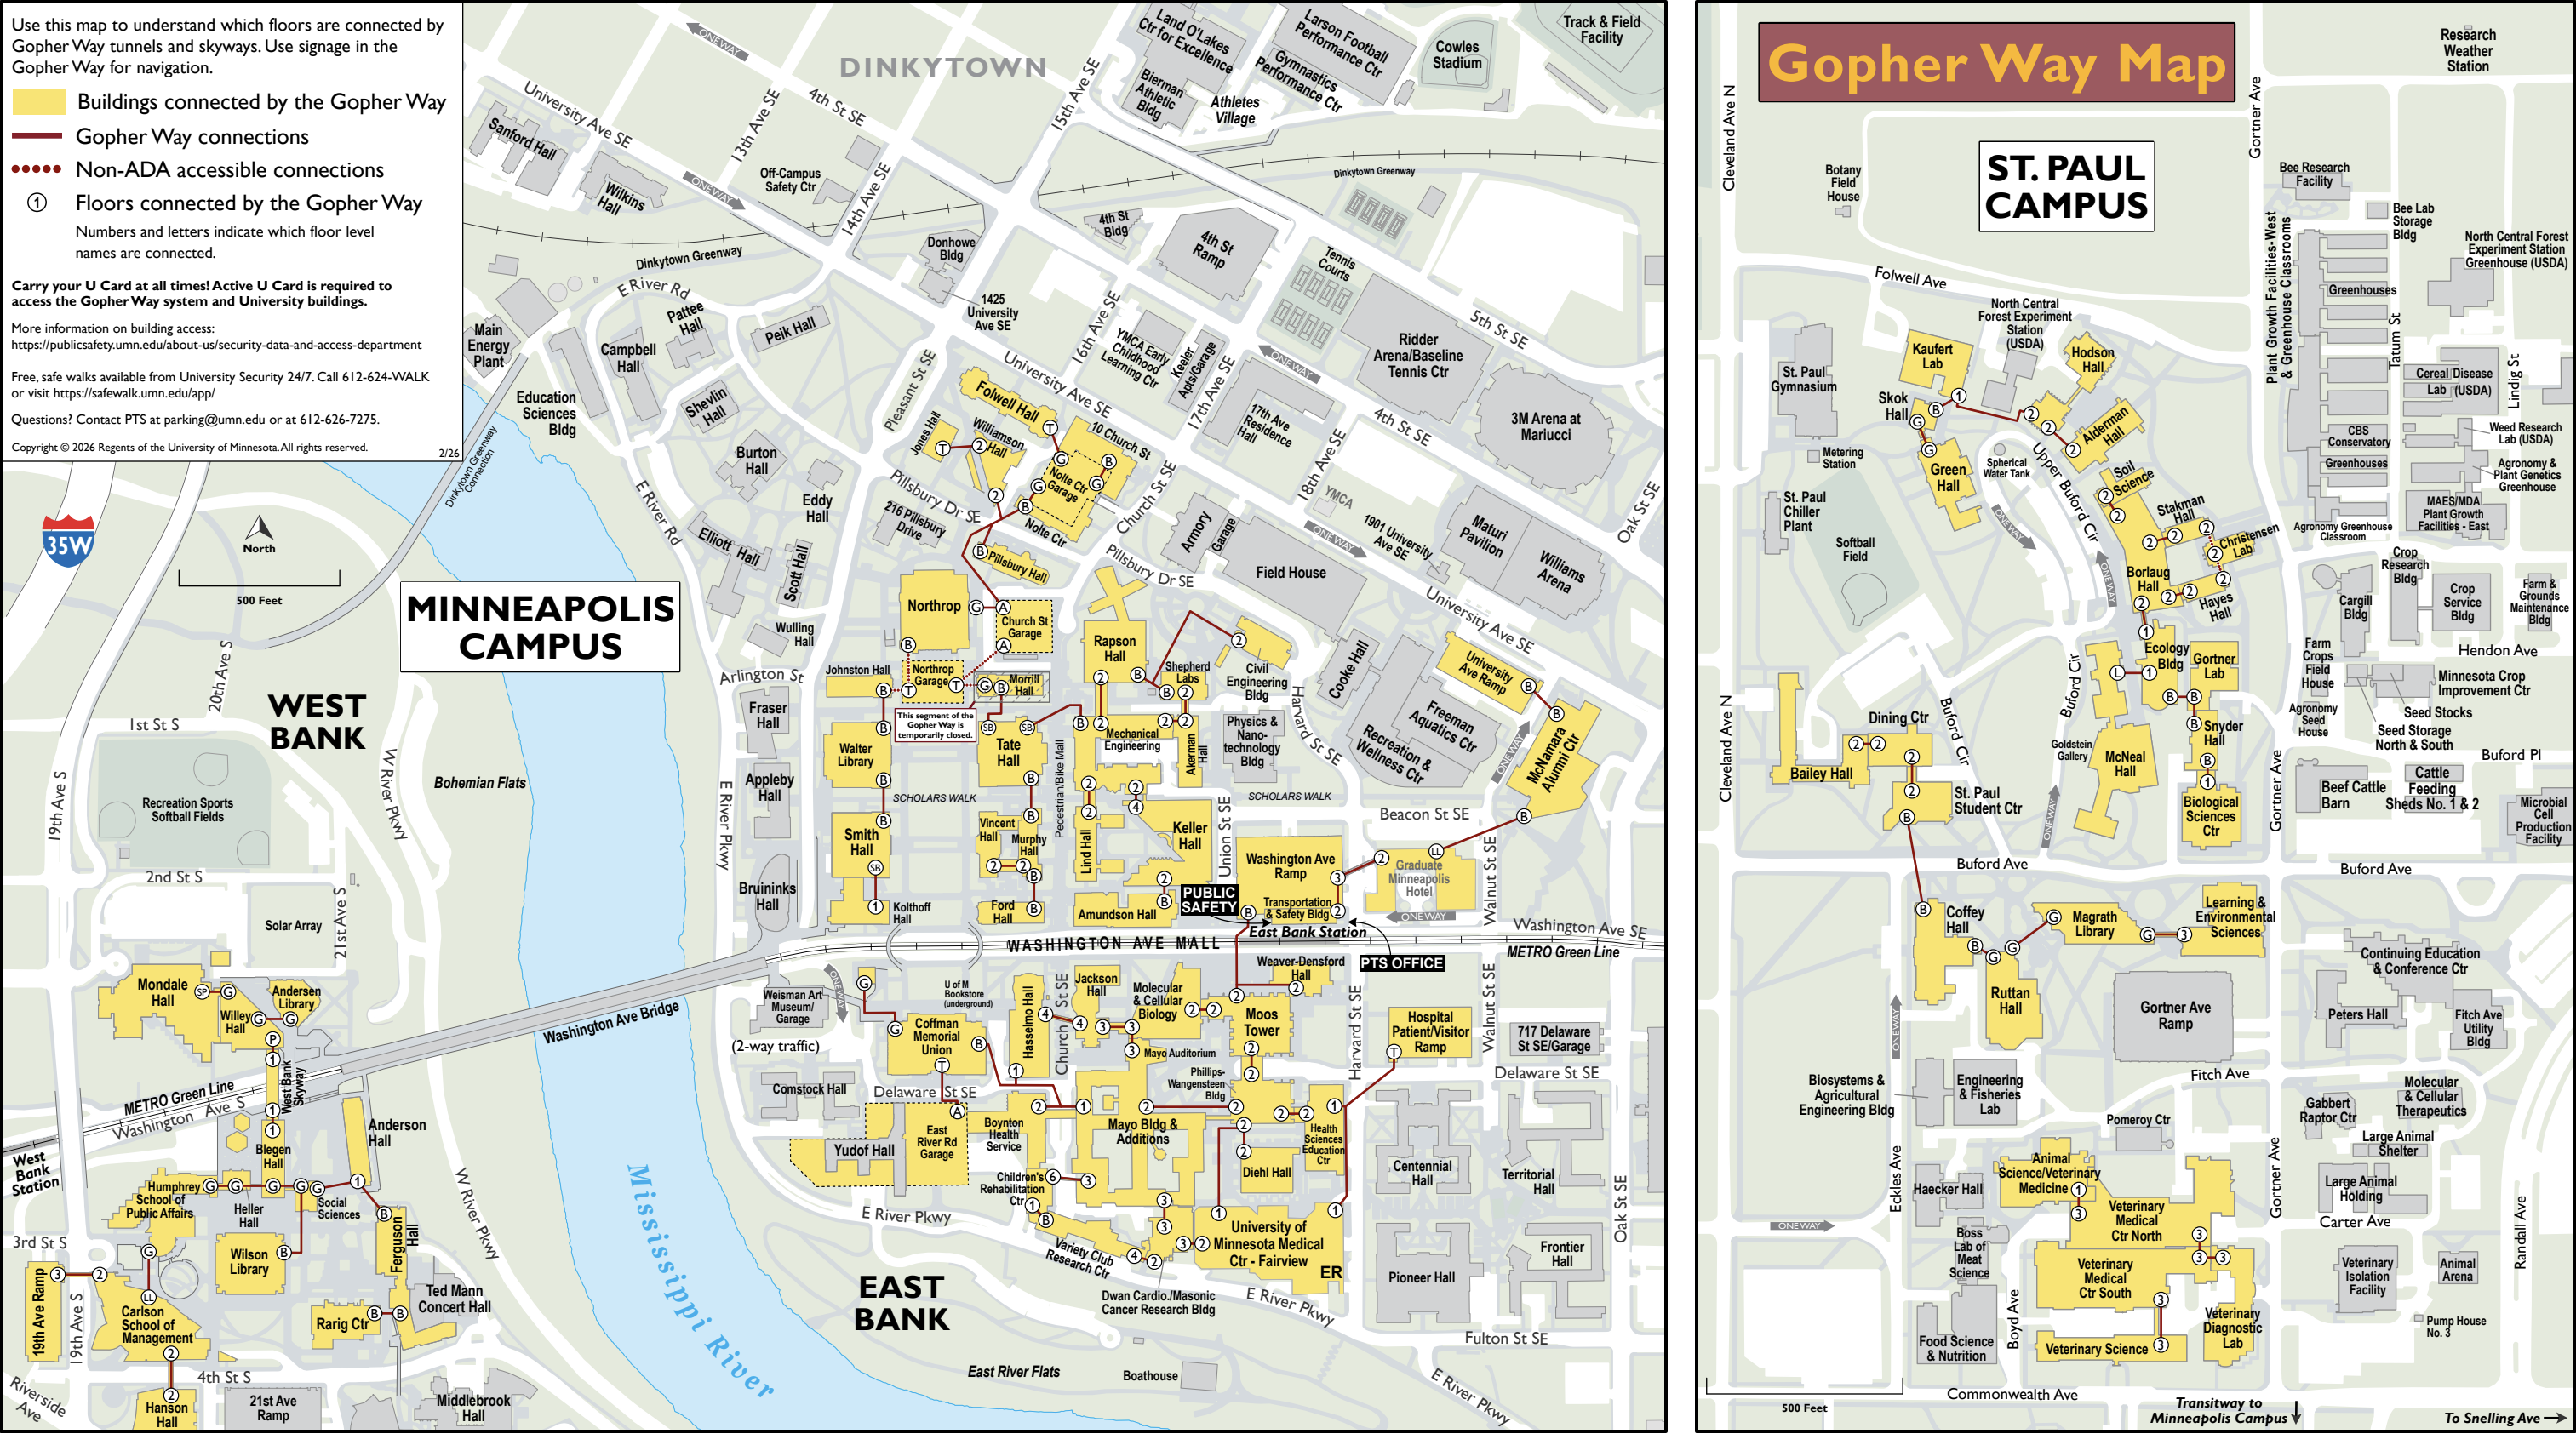
That one moment defined the project. The University of Minnesota's Gopher Way connects 7+ miles of underground tunnels and skyways across campus. On paper, it means students never have to brave a Minnesota winter between classes. In practice? Most students avoided it entirely.
Not because they didn't know it existed. Because they couldn't predict whether their route would actually work. Building hours change. Doors lock without warning. One blocked entrance mid-route costs more time than just going outside. So students kept making the rational choice: take the guaranteed bad option over the uncertain good one.
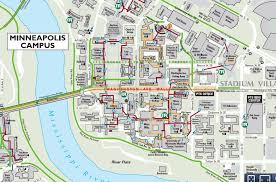
The data backed it up. Building hours were scattered across 12 different department websites. Official tunnel maps were static PDFs last updated in 2019. Google Maps routed outdoors. There was no single tool that put it together and students were paying the price every winter.
How We Found the Real Problem
Before we opened Figma, we went outside in September with the students.
What We Saw vs. What We Expected
We shadowed 15 students navigating campus during actual winter conditions — not in a lab, not via survey. What we expected: students struggling to find tunnel entrances. What we actually saw: students finding entrances just fine, then turning around anyway.
The hesitation was the data point. Students were doing a mental risk calculation at every tunnel entrance: "If this route is blocked halfway through, I've lost more time than if I just go outside now." The problem wasn't awareness. It was predictability. That single insight changed everything about what we built.
Mapping 40+ Scenarios
We ran Hierarchical Task Analysis across 40+ navigation scenarios — from a simple 2-building hop to a complex multi-stop route during a building closure. The HTA revealed something counterintuitive: most campus navigation isn't long cross-campus trips. It's short 1–3 building hops. That meant our UI needed to optimize for a 10-second lookup, not a trip planner.
The HTA also showed us exactly when building hours mattered: not at the start of a journey, but in the middle of one. Students weren't pre-planning routes at their desk — they were making decisions at tunnel entrances, in real time, in coats and gloves. The solution had to work in that moment.
Three Rounds of Testing
We tested at every stage — Figma prototype, MVP, functional prototype — with 8, 10, and 7 participants respectively. Round 2 gave us our most important finding: users were following routes without realizing they'd been sent outdoors. Single-color map lines looked identical whether they represented a tunnel or a sidewalk. That's where the maroon/gold visual system came from — not a design preference, a usability failure we observed and fixed.
How We Built It
Discover: The Predictability Problem
Three weeks of field research produced one sentence that drove every decision: students don't avoid tunnels because they don't know about them — they avoid them because they can't trust them. Once we had that, scope became obvious. The product needed to guarantee route completeness, not just show tunnel paths.
Define: What We Would and Wouldn't Build
We made an explicit list of features we were NOT building: real-time building hour API updates, turn-by-turn indoor navigation, Minneapolis/St. Paul campus cross-linking, schedule integration. Every one of these was a real request from early user interviews. Every one of them was cut deliberately — not because they weren't valuable, but because they would have made it impossible to ship a reliable core product by December.
Scope discipline is a design skill. We wrote a Project Scope Statement, got team sign-off on it in week two, and referenced it every time someone suggested adding a feature.
On the ground, students were still reconciling scattered building hours and static PDF maps with what they saw on tunnel walls — official Gopher Way signage helped orient people, but it could not answer "is this entire route open right now?" That gap is what we designed against.
Develop: Three Stages, Three Deployed Versions
October 15 — Figma Prototype
Full interactive prototype before any code. Round 1 testing immediately surfaced that map-tap input was too slow for users in motion. We rebuilt around search-first input before writing a line of code — saving weeks of implementation rework.
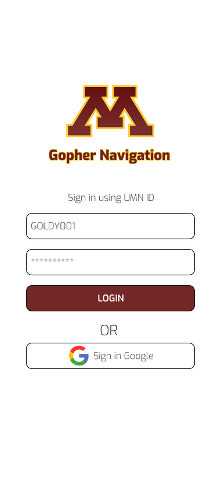
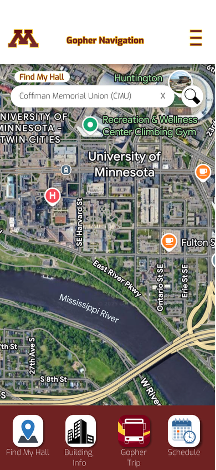
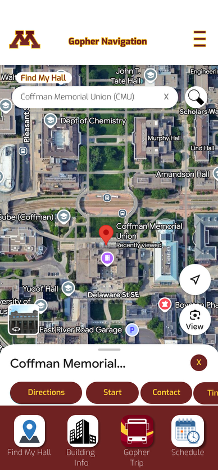
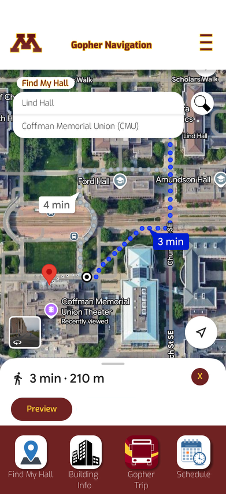
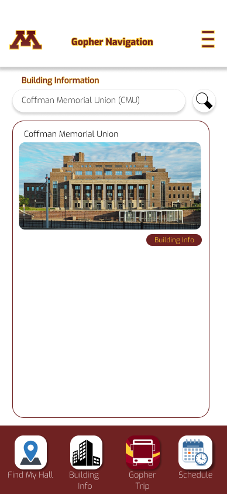
Selected Figma prototype screens (pre-code)
.png)
.png)
November 3 — MVP
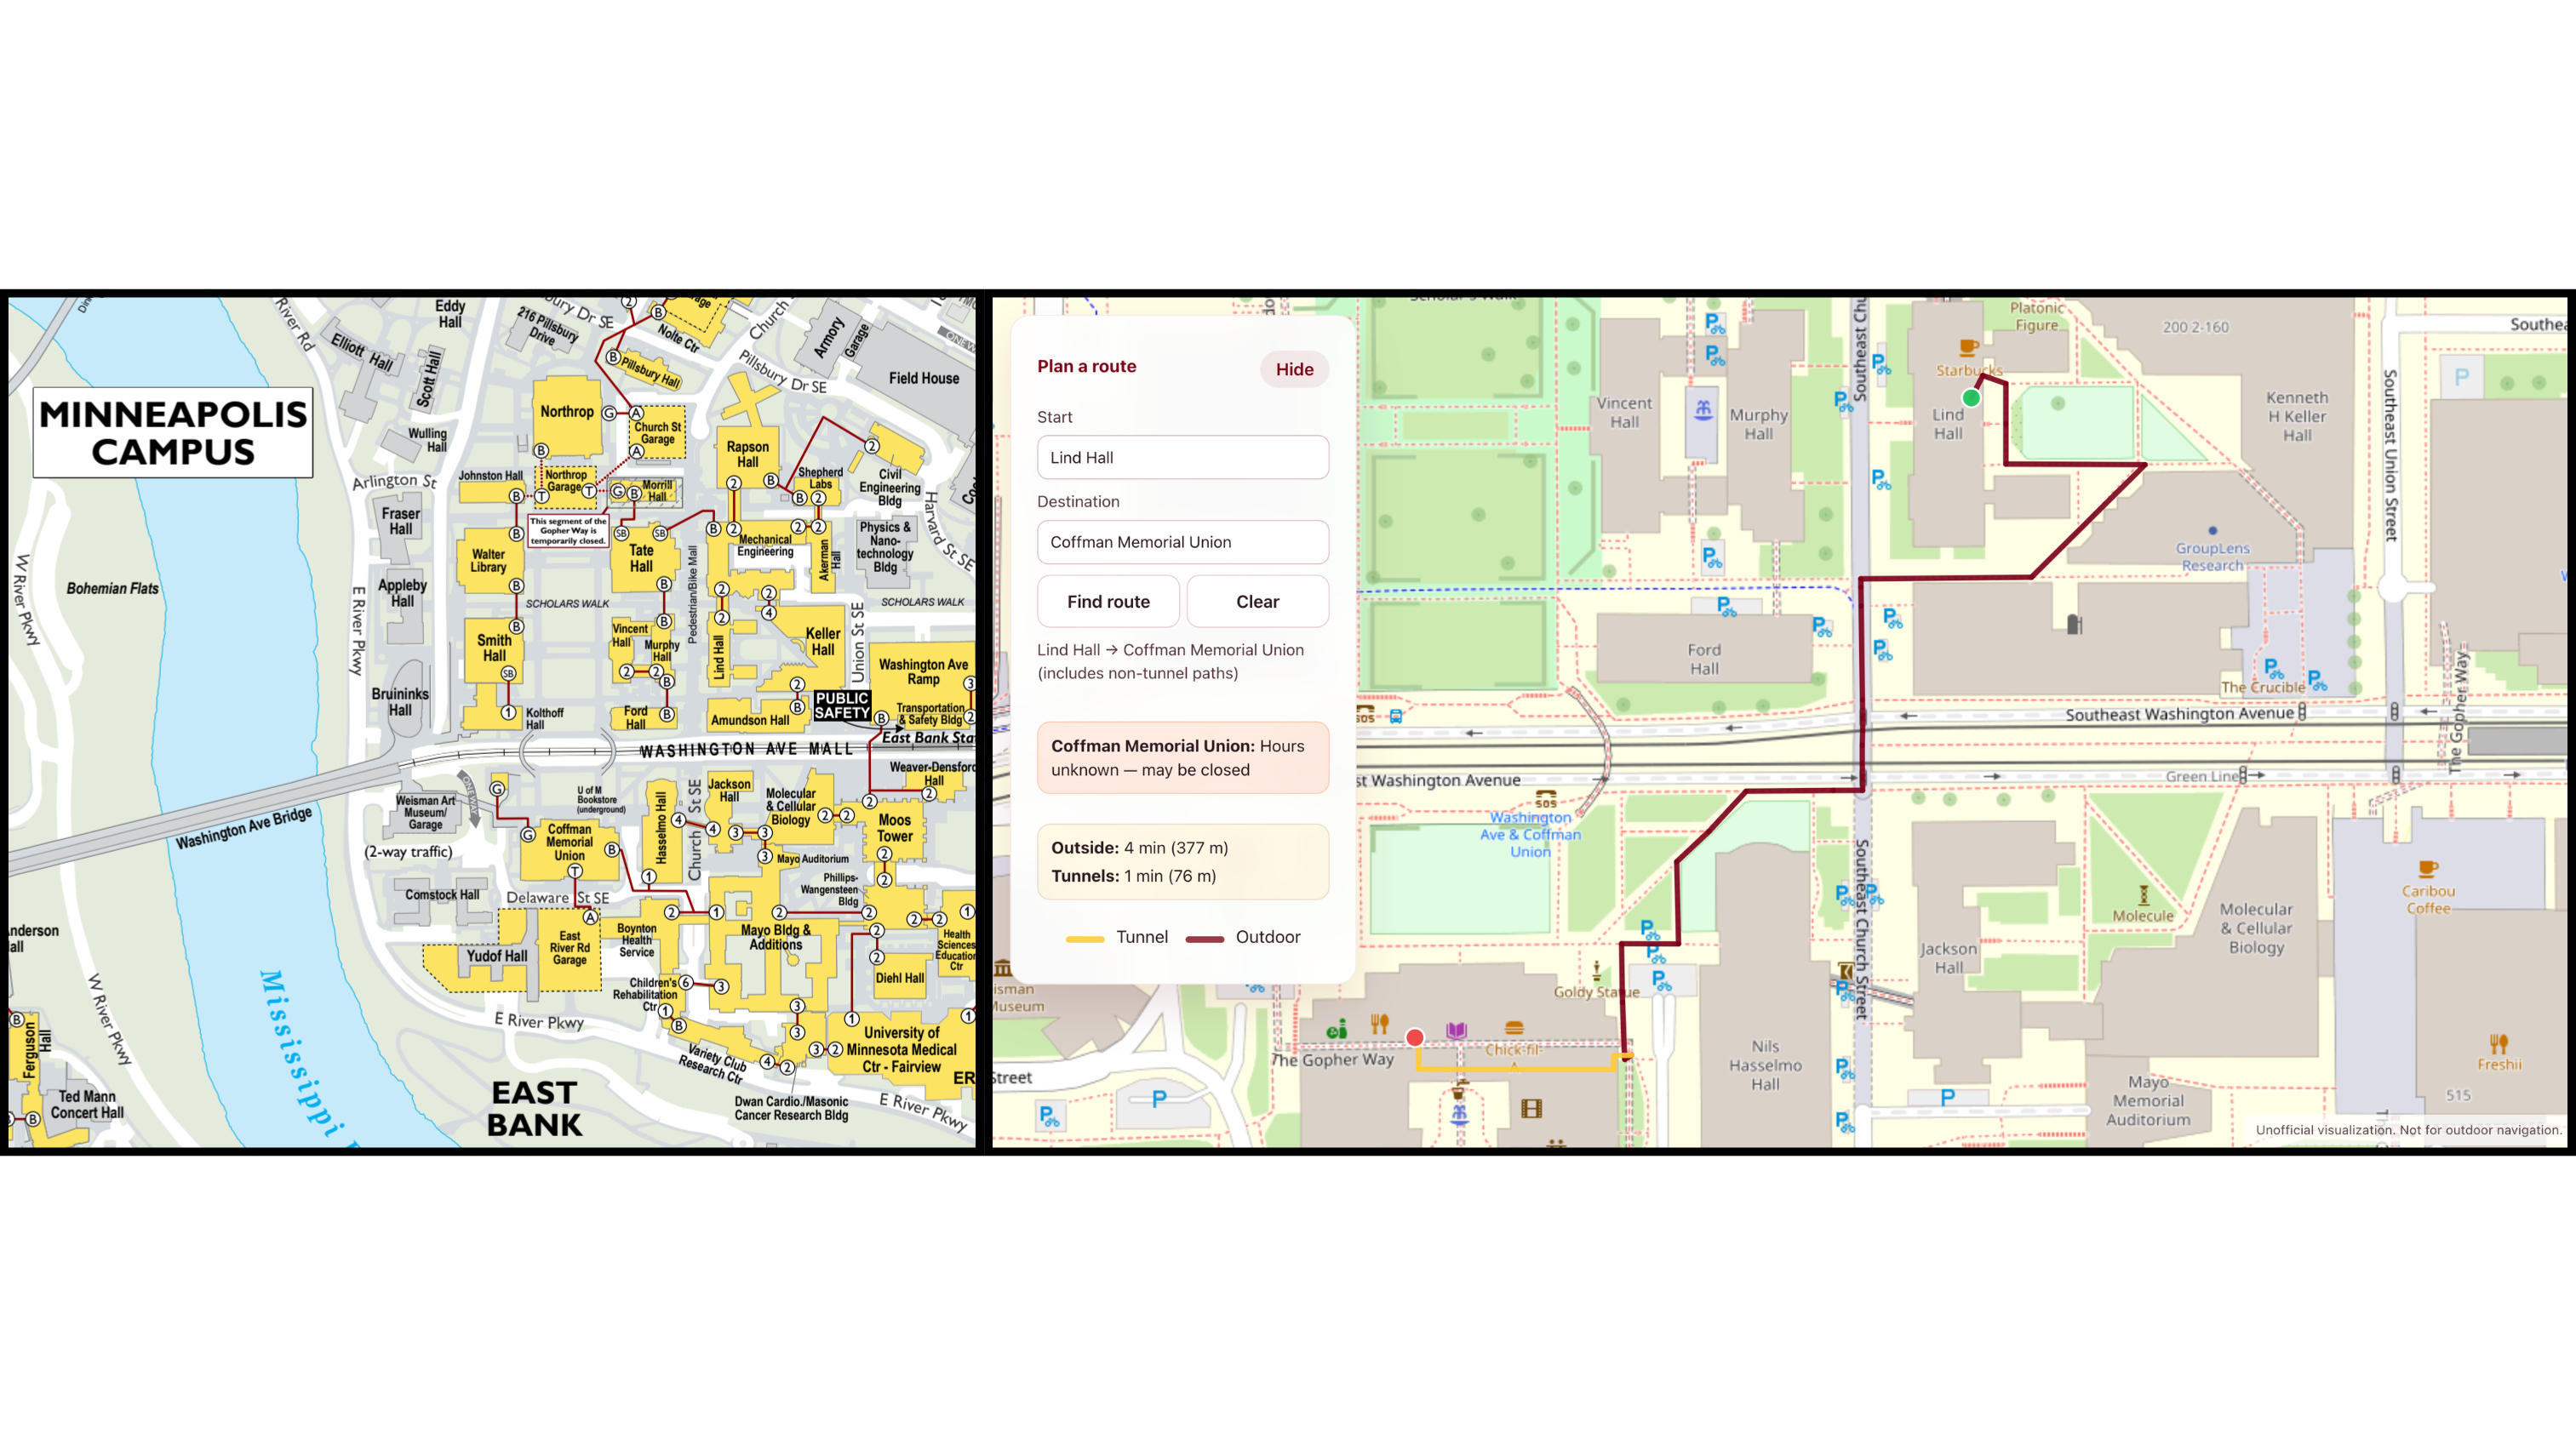
Live at campus-sync.org. Basic routing, map overlay, and the dual-color system. Maroon for tunnels. Gold for outdoor segments. University of Minnesota brand colors — immediately readable without a legend.
November 17 — Functional Prototype
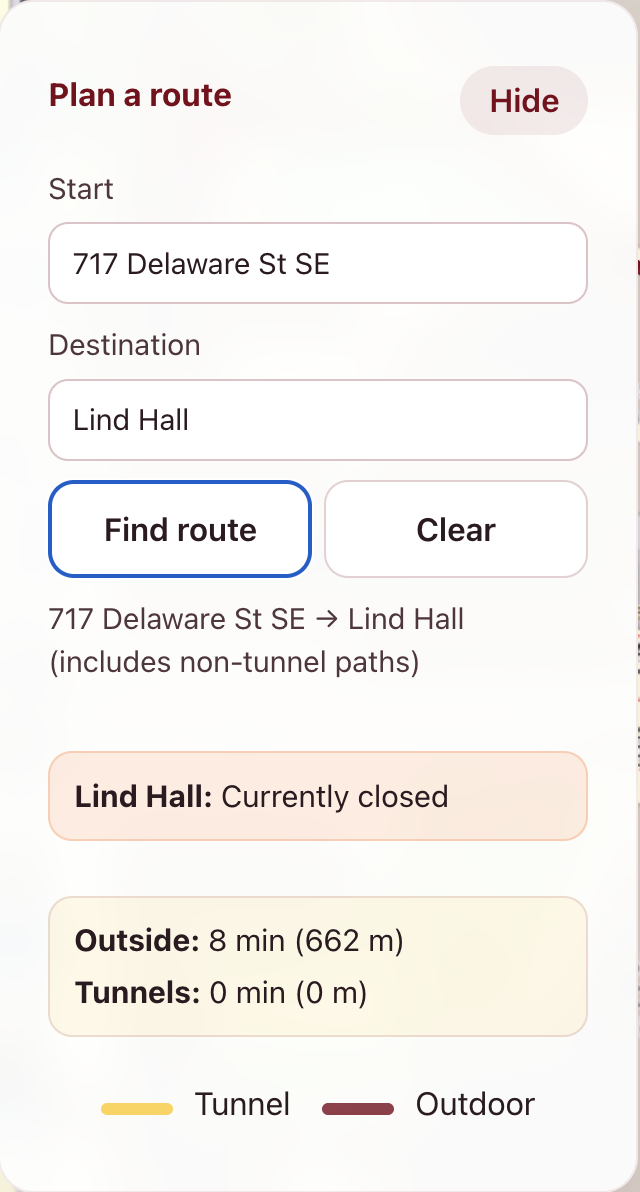
Building-hour filtering integrated directly into the routing engine. The algorithm queries current building access status before pathfinding, so it never suggests a route through a locked building. Validated at 90%+ accuracy against 20 manually-verified routes.
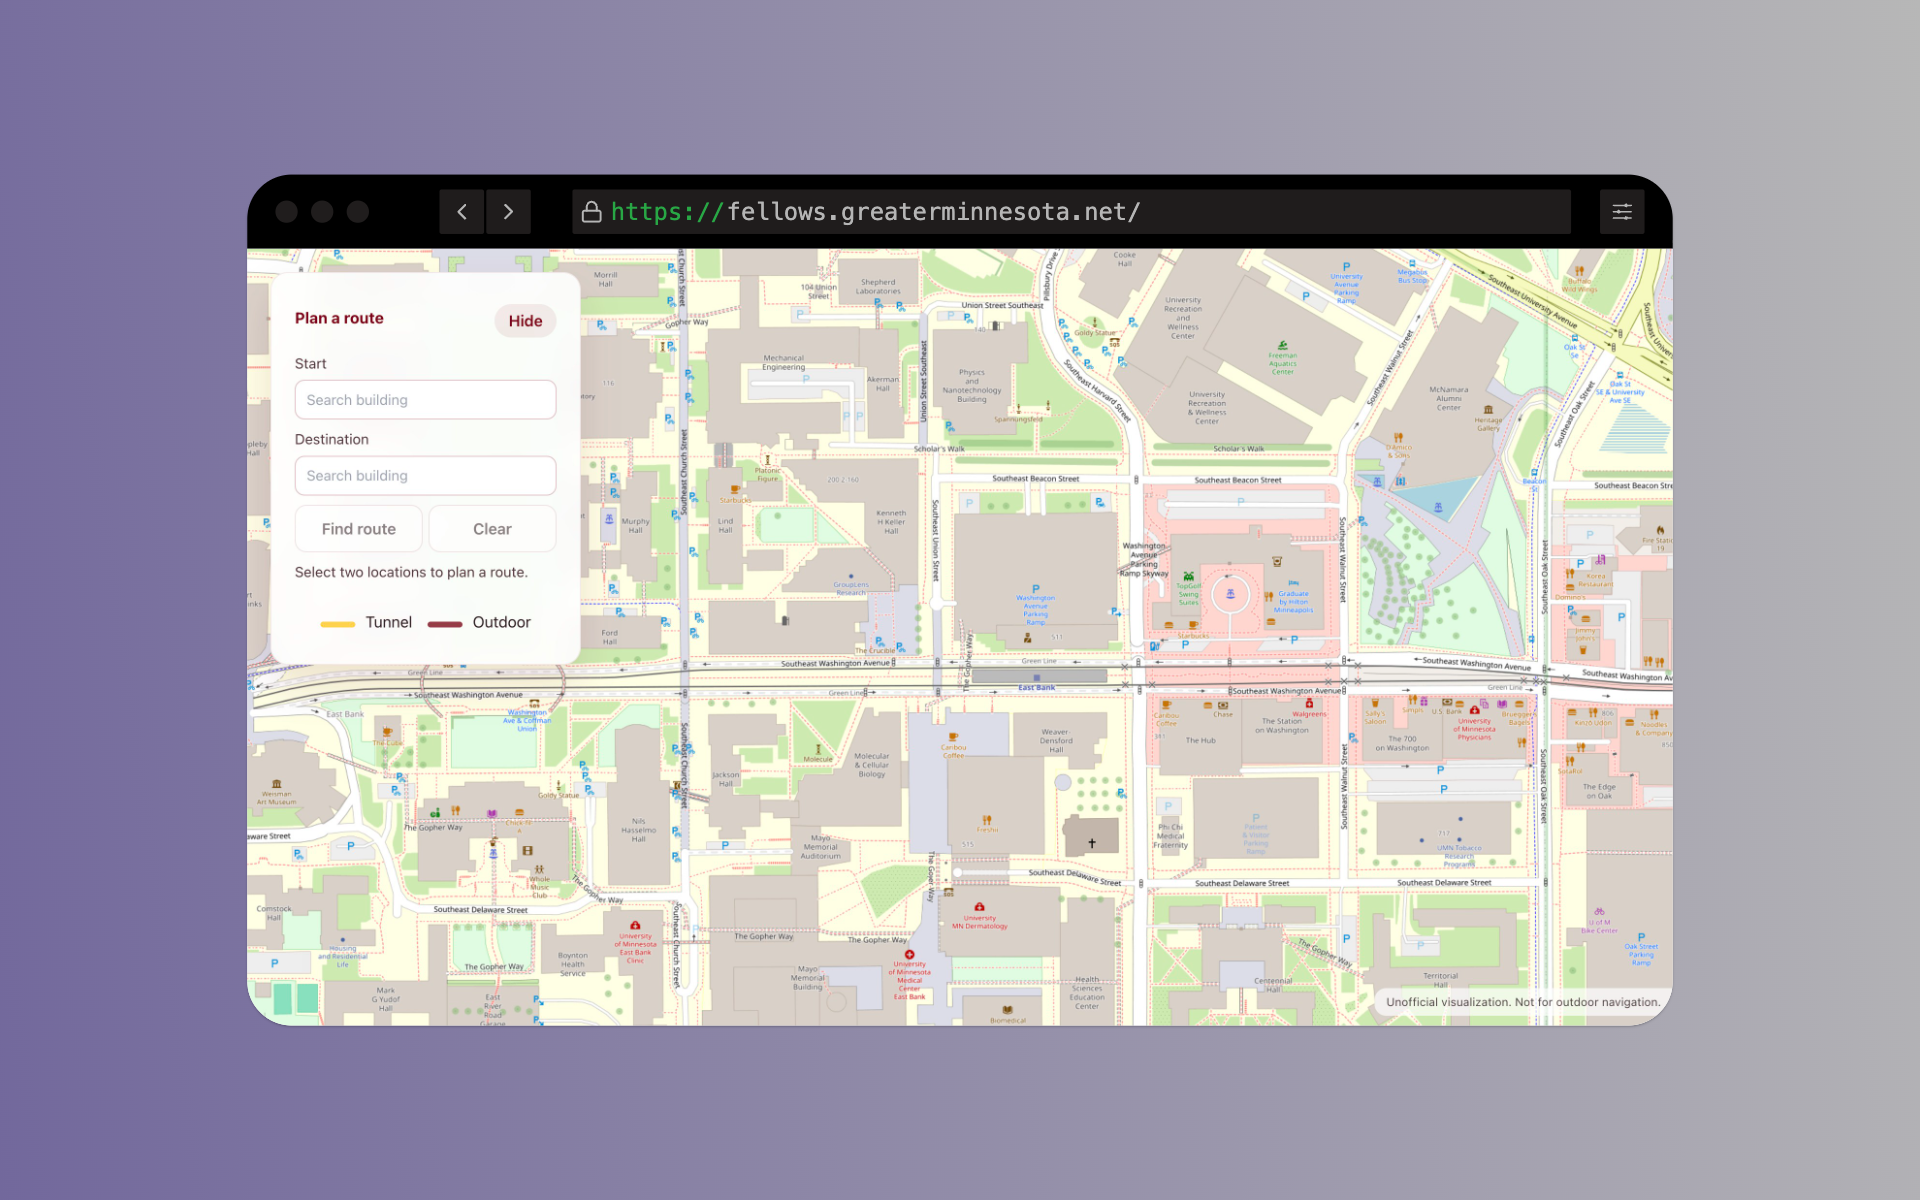
Live embed. If this area stays blank, framing may be blocked — use campus-sync.org in a new tab.
The Decision That Changed Everything
Why We Moved from Mobile App to Web Product
The Figma prototype started as a native mobile app — login screen, bottom navigation bar, map-tap input. It felt like the right instinct: students use their phones, so build for phones. But the first prototype wasn't really about the interface. It was about answering a more fundamental question: would students actually use a tool like this at all, or would they keep defaulting to going outside?
That phase gave us our answer — and something we didn't expect. Students found the app concept intuitive enough to navigate, but the learning curve of a new installed app created friction before they even got to the routing. They needed to understand what the product did before they could trust it. A native app asks users to commit before they've seen the value.
So we made the call to ship as a web product instead. No download. No login. Open a link, type two buildings, get a route. The barrier to first use dropped to zero — which mattered enormously for a product that students had to trust enough to use mid-route, in a coat, in the cold. The web format let the product prove itself before asking anything of the user.
The first prototype wasn't a failed design. It was the research that made the right design obvious.
Deliver: Two Fixes That Mattered
Pilot testing gave us 10+ feedback responses. We implemented exactly two improvements — chosen by impact, not by ease. First: tunnel overlay visual weight increased so segments were distinguishable from building outlines on mobile screens. Second: dropdown menus rebuilt as bottom-sheet components on mobile, eliminating the overflow issue affecting phones under 390px width. Both fixes were regression-tested before the December 9 final release.
What We Built
CampusSync is live at campus-sync.org. No login. No installation. Open it, type where you are, type where you're going, get a route you can actually trust.
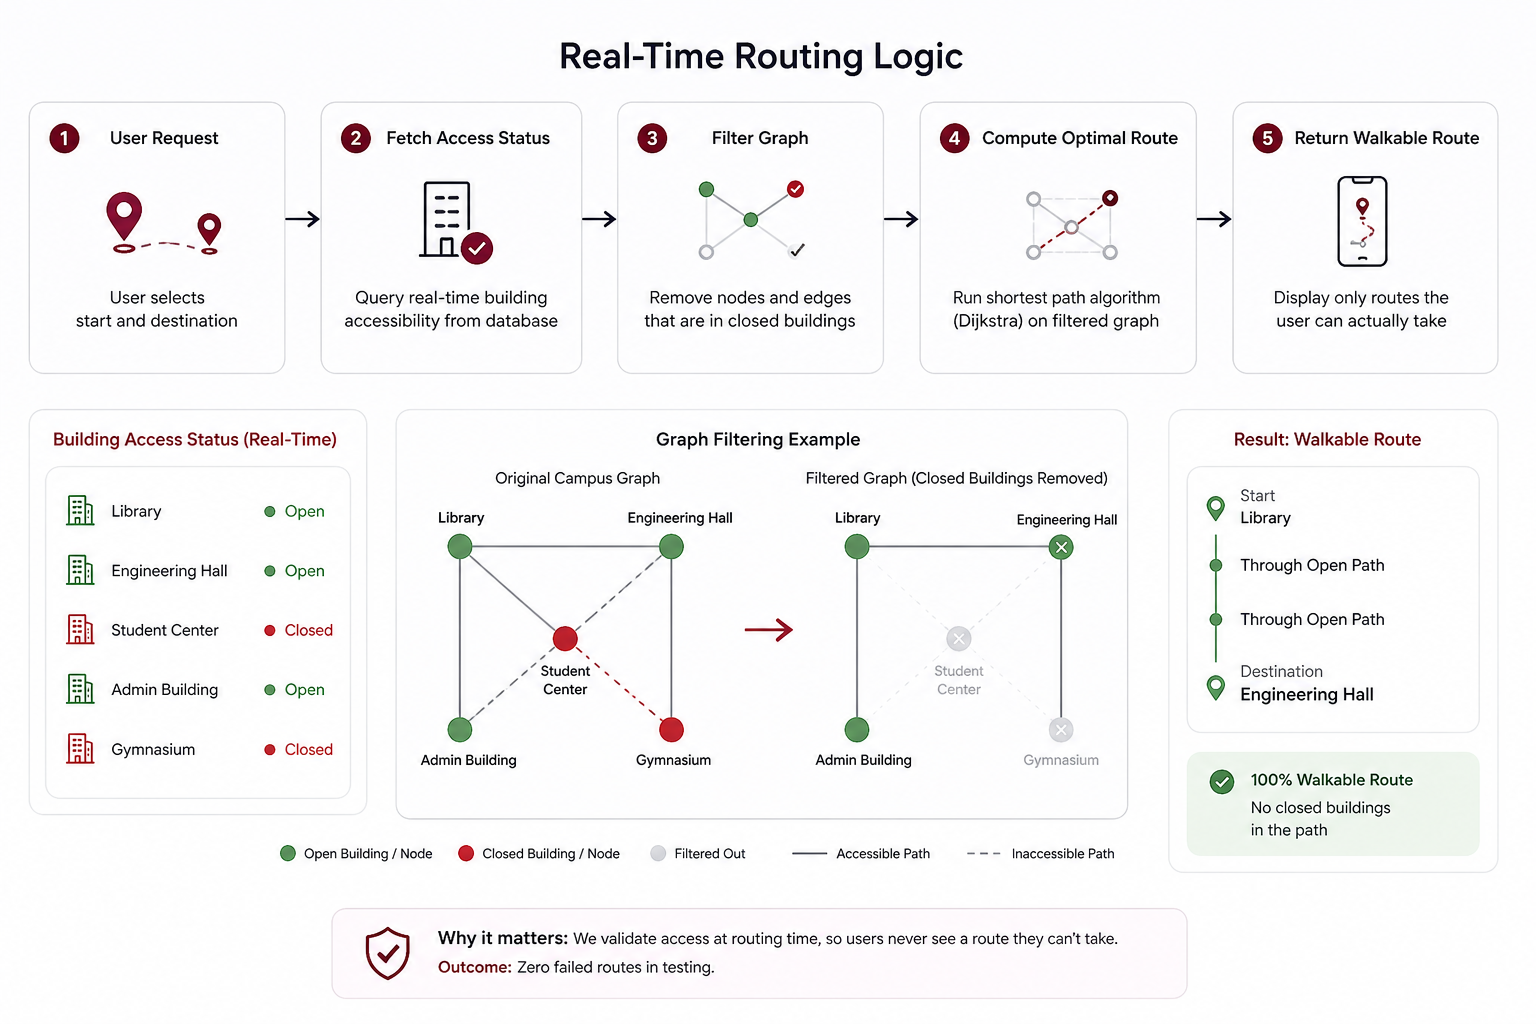
The Routing Engine
The core innovation isn't the map — it's what happens before the map renders. The routing engine queries building access status at routing time, filters out any path that goes through a currently-closed building, then runs pathfinding on the remaining graph. Users never see a route they can't walk. That's the feature that changed behavior.
The Visual System
Maroon lines = tunnels. Gold lines = outdoors. Two colors, zero ambiguity. Round 2 usability testing showed users following routes without realizing they'd gone outside — the original single-color overlay gave no signal. The dual-color system made the distinction impossible to miss, even on a small mobile screen while walking.
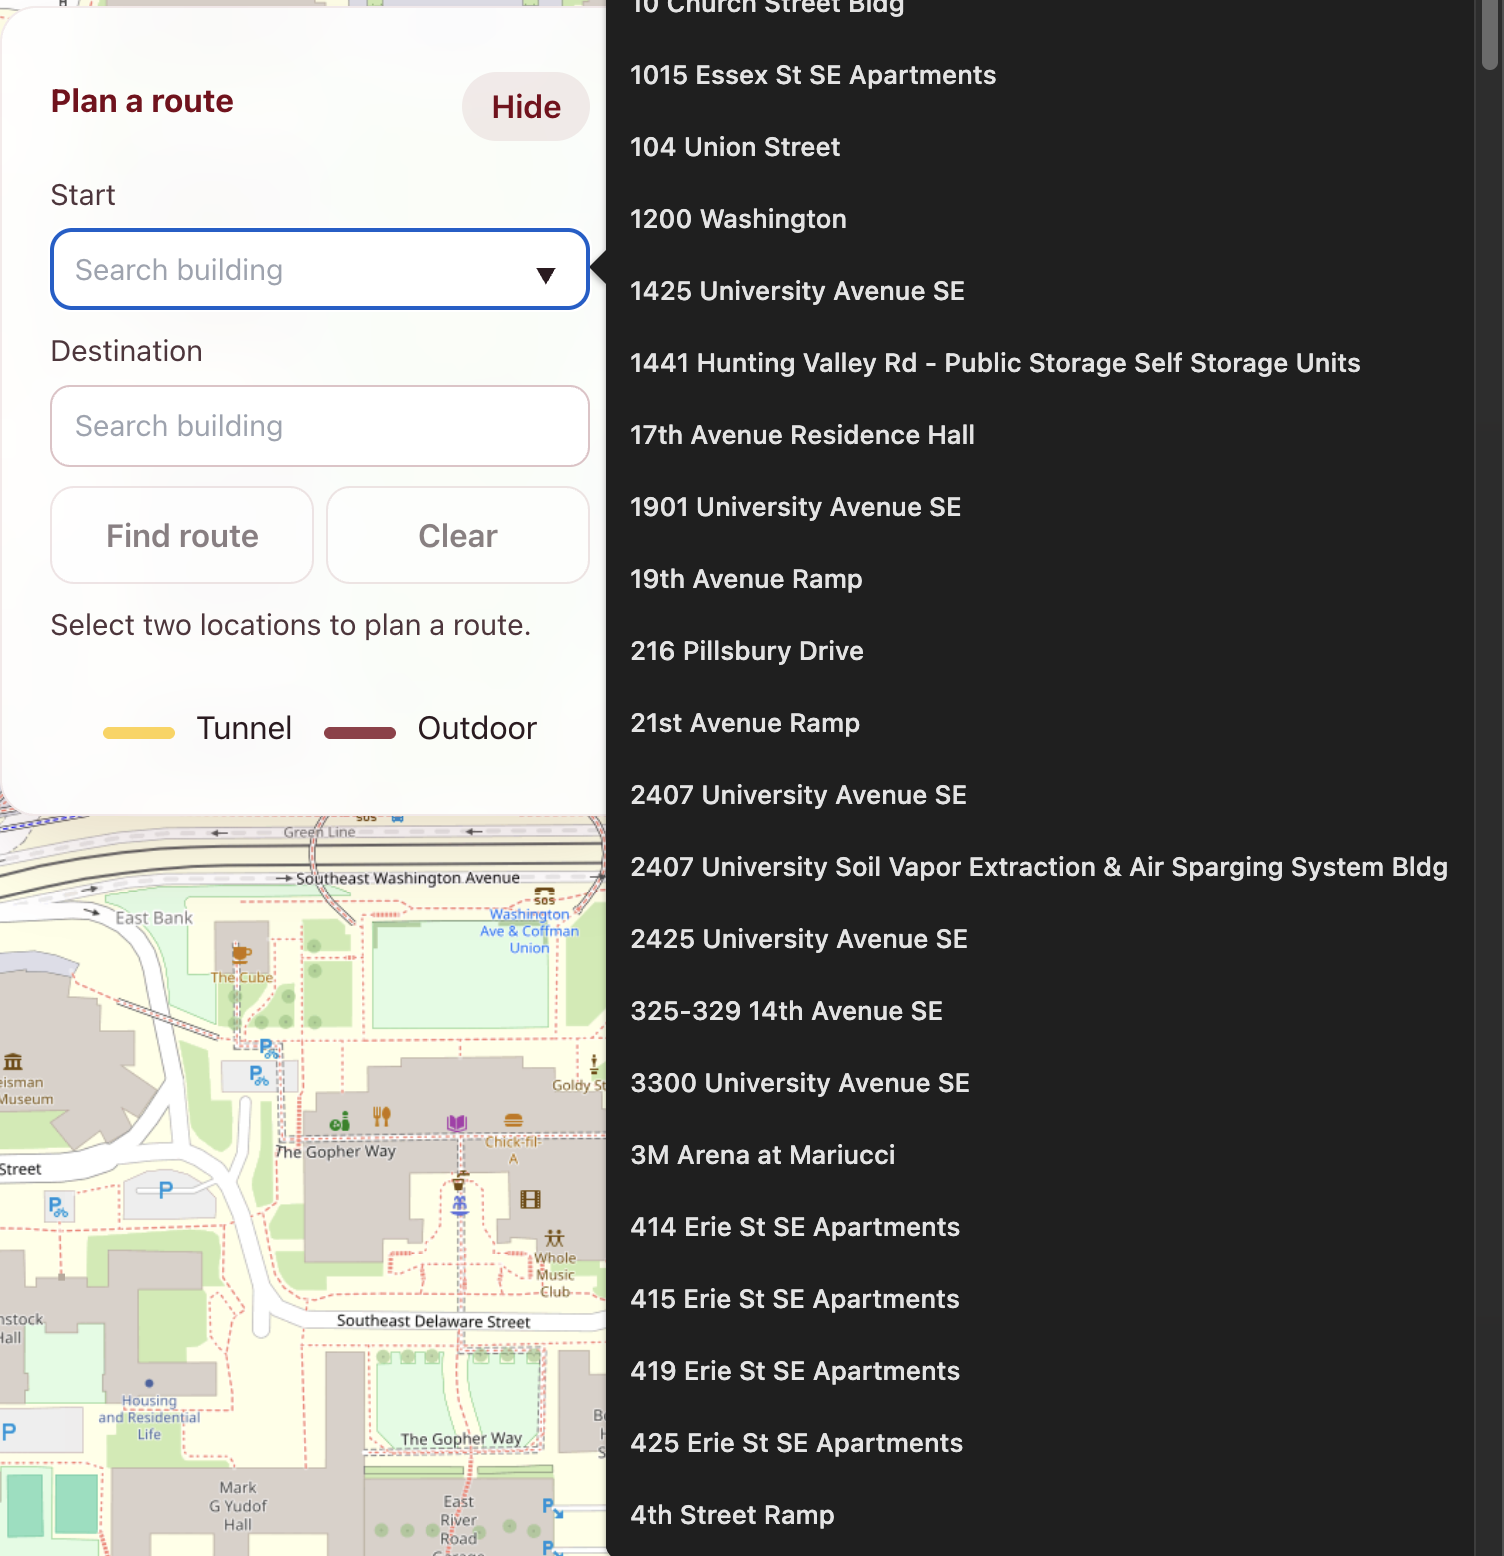
The Input Model
Search-first, not map-click. Round 1 testing showed that tapping a small building on a map while moving was too slow and too error-prone. The search field uses autocomplete restricted to buildings in the navigable network — so users only see options that the routing engine can actually connect.
The Walking Time Estimate
Added in response to a specific pilot testing question: "Is this actually faster than going outside?" Students needed to make that comparison in real time. The time estimate displays prominently for both indoor and outdoor segments, so the decision is instant.
Devices & visual feedback
We validated the live product on the hardware students actually carry — not lab desktops — and captured quick visual-appeal signal after task-based sessions.
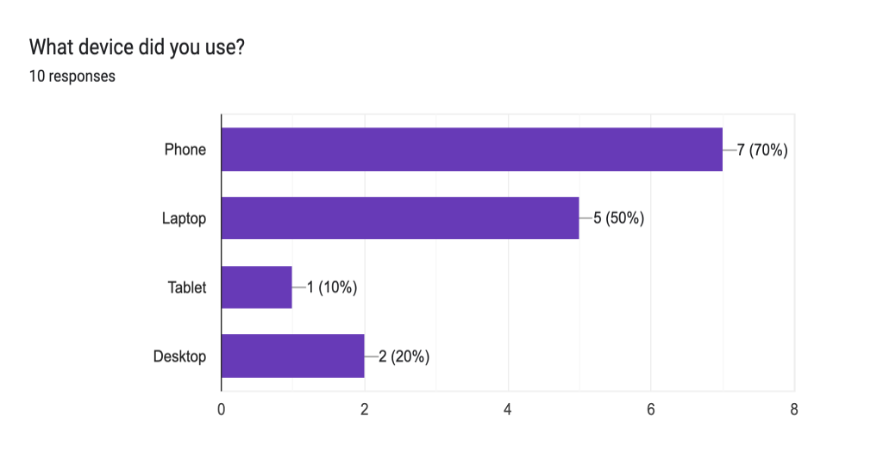
Devices used to check the website
Sessions were run on participants' own phones and a shared set of common screen sizes (including narrower devices under 390px width) so layout, tap targets, and route legibility matched real winter use.
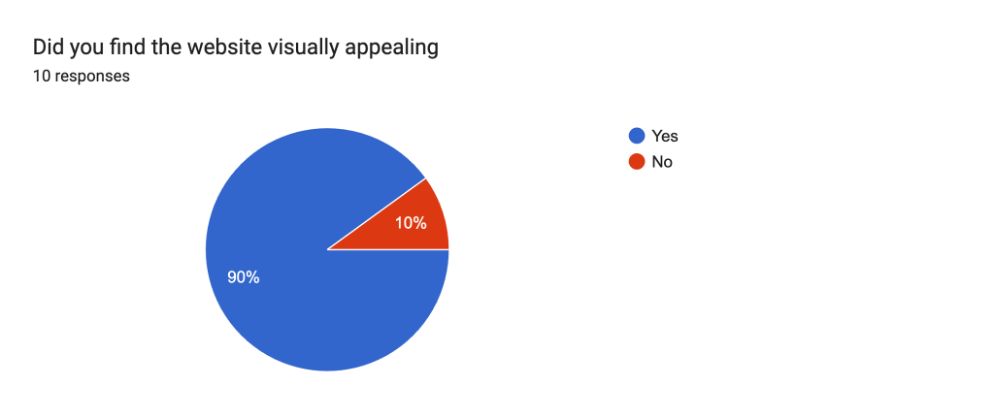
Visual appeal (post-task survey)
In a short follow-up survey (n=10), 90% of participants said they found the website visually appealing — a useful sanity check alongside task metrics that the interface felt credible, not just functional.
What Changed
Every metric we defined before building anything, we hit or beat. That matters — these weren't goals we set after seeing the results.
- SUS Score: 82/100. The industry average is 68. For a first-semester product with no prior version to iterate from, 82 is a strong result.
- Routing accuracy: ~90%. Validated against 20 manually-checked routes. The 10% gap is entirely attributable to Minneapolis/St. Paul cross-campus connections — a known scope exclusion documented before we started building.
- Task completion: 45% faster than the existing combination of PDF maps and scattered building-hours pages.
- Mobile adoption: 70%. Students used it on their phones while physically navigating. Not at their desks. The mobile-first design decision was validated by the people it was designed for.
- User satisfaction: 80%+. Meeting the pre-defined threshold exactly.

The qualitative feedback was equally useful. The dual-color route visualization was the single most-cited positive feature — described as "immediately obvious" and "the thing that made it actually useful." The most-cited limitation was Minneapolis/St. Paul routing — which the team had documented as a user misconception before launch. The tunnels don't connect the campuses. That's not a missing feature. That's a geography problem.
CampusSync launched December 9, 2025 and is actively serving University of Minnesota students.
Team: Nick Kanning, Chandan Umesh Pai, Saad Saleem, David Tomlinson
Guided by:Prof. Kathryn Wust & Prof. Scott Hareland